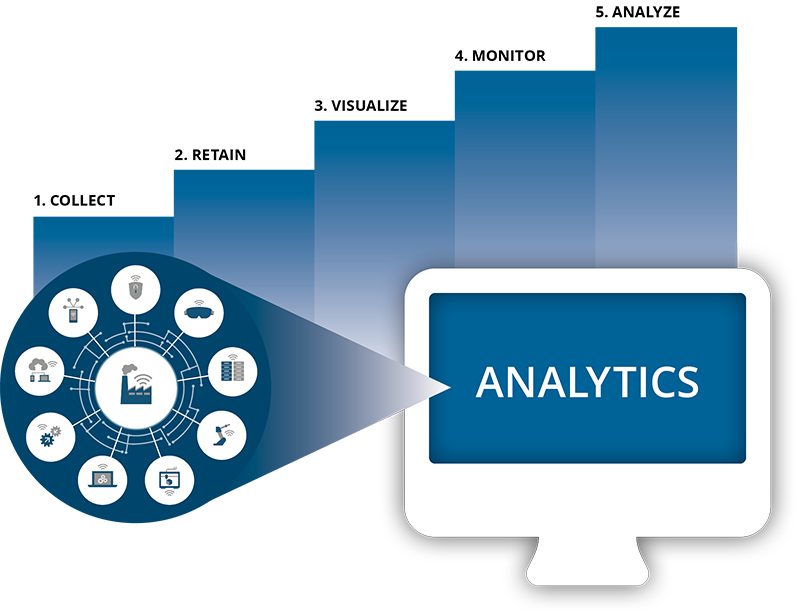
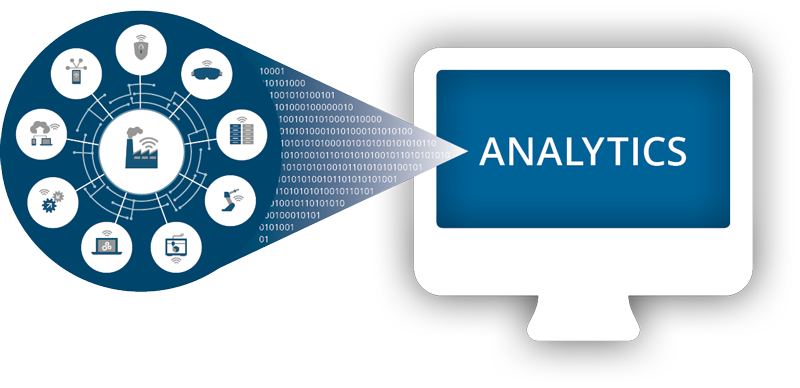
The analytics potential offered by IIoT is directly proportional to the pool of plant and machinery actively supplying data. Do you already know the data that is available and how it is collected? The machine pool may need retrofitting with suitable sensors to achieve added value from an IIoT solution.
Even if you are not planning to make a sizeable capital investment across your entire factory, you can always select just one production line for a pilot project or as a proof of concept (PoC).
While some manufacturers have integrated smart sensors throughout the factory and are capable of generating production process data, the systems, personnel, and processes needed for the consistent collection and regular retention of this data are still lacking, however. More sophisticated and mature manufacturers have implemented data historians or industrial analytics platforms designed to scale across thousands of data points and integrate with existing SCADA, MES, or ERP systems. These operational technology (OT) systems store vast amounts of time-series data in a highly-compressed, yet readily-accessible format for real-time analytics.
With a comprehensive IIoT data strategy in place, you can correlate data from a variety of sensors instantly, setting the stage for later identifications of the root cause of system anomalies and corresponding corrective actions to address similar kinds of issues in the future.
Checklist:
- How much data should be retained?
- Where should this data be stored?
- How often is this data accessed?
Data from plant and machinery is not valuable merely because it is available. Data by itself is meaningless. Manufacturers must be able to visualize and draw insights from the data they collect in order to fully unlock its value.
- Self-service tools: Stand-alone platforms such as Tableau or QlikView provide advanced functionality for the visualization of historical trends and data patterns, but sometimes have steep learning curves or require expertise only available to professional data scientists.
- A practical alternative here are platforms for industrial data analysis that offer integrated, user-friendly capabilities for real-time data visualization. Designed for business users, they are aimed at companies looking for an all-in-one solution instead of another series of modular software packages.
With systems, processes and workflows in place for the real-time monitoring of fluctuations in sensor data, manufacturers are able to act to correct batch production processes, identify pending equipment failure, and prevent unplanned downtime. Industrial data analytics platforms can therefore enable the configuration of custom alert thresholds for each device, sensor and machine. Variations in temperature, pressure, voltage, vibration or flow rate trigger warning notifications for production managers via e-mail, text message or onscreen system alert.
The ability to proactively improve performance, predict future problems, and transition from preventive to predictive maintenance is the ultimate destination on the road to IIoT, and the final stage of maturity within the industrial analytics lifecycle. Recent advances in Big Data analytics and new machine learning algorithms now make real-time analysis solutions possible that can compare historical trends with forward-looking projections so as to predict future performance.


![[Translate to English:] IIot Daten archivieren - BIG DATA](/fileadmin/img/datenanalyse/IIoT-Analytics-Daten-archivieren.png)
![[Translate to English:] IIot Trends visualisieren - Industrie 4.0](/fileadmin/img/datenanalyse/IIoT-Analytics-Trends-visualisieren.png)
![[Translate to English:] Industrie 4.0 Alarme überwachen - Fehler beheben](/fileadmin/_processed_/a/e/csm_IIoT-Analytics-Alarm-ueberwachen_b43d1db806.png)
![[Translate to English:] IIot Industrie 4.0 Produktionsleistung analysieren](/fileadmin/_processed_/4/7/csm_Industrie-4-Produktionsleitung-Analysieren_ca9ce5bfe7.png)